Dashboard | Rabbit Accounts Use-Case Library
Use this page for technical screen behavior, source references, and active Playwright coverage.
Dashboard
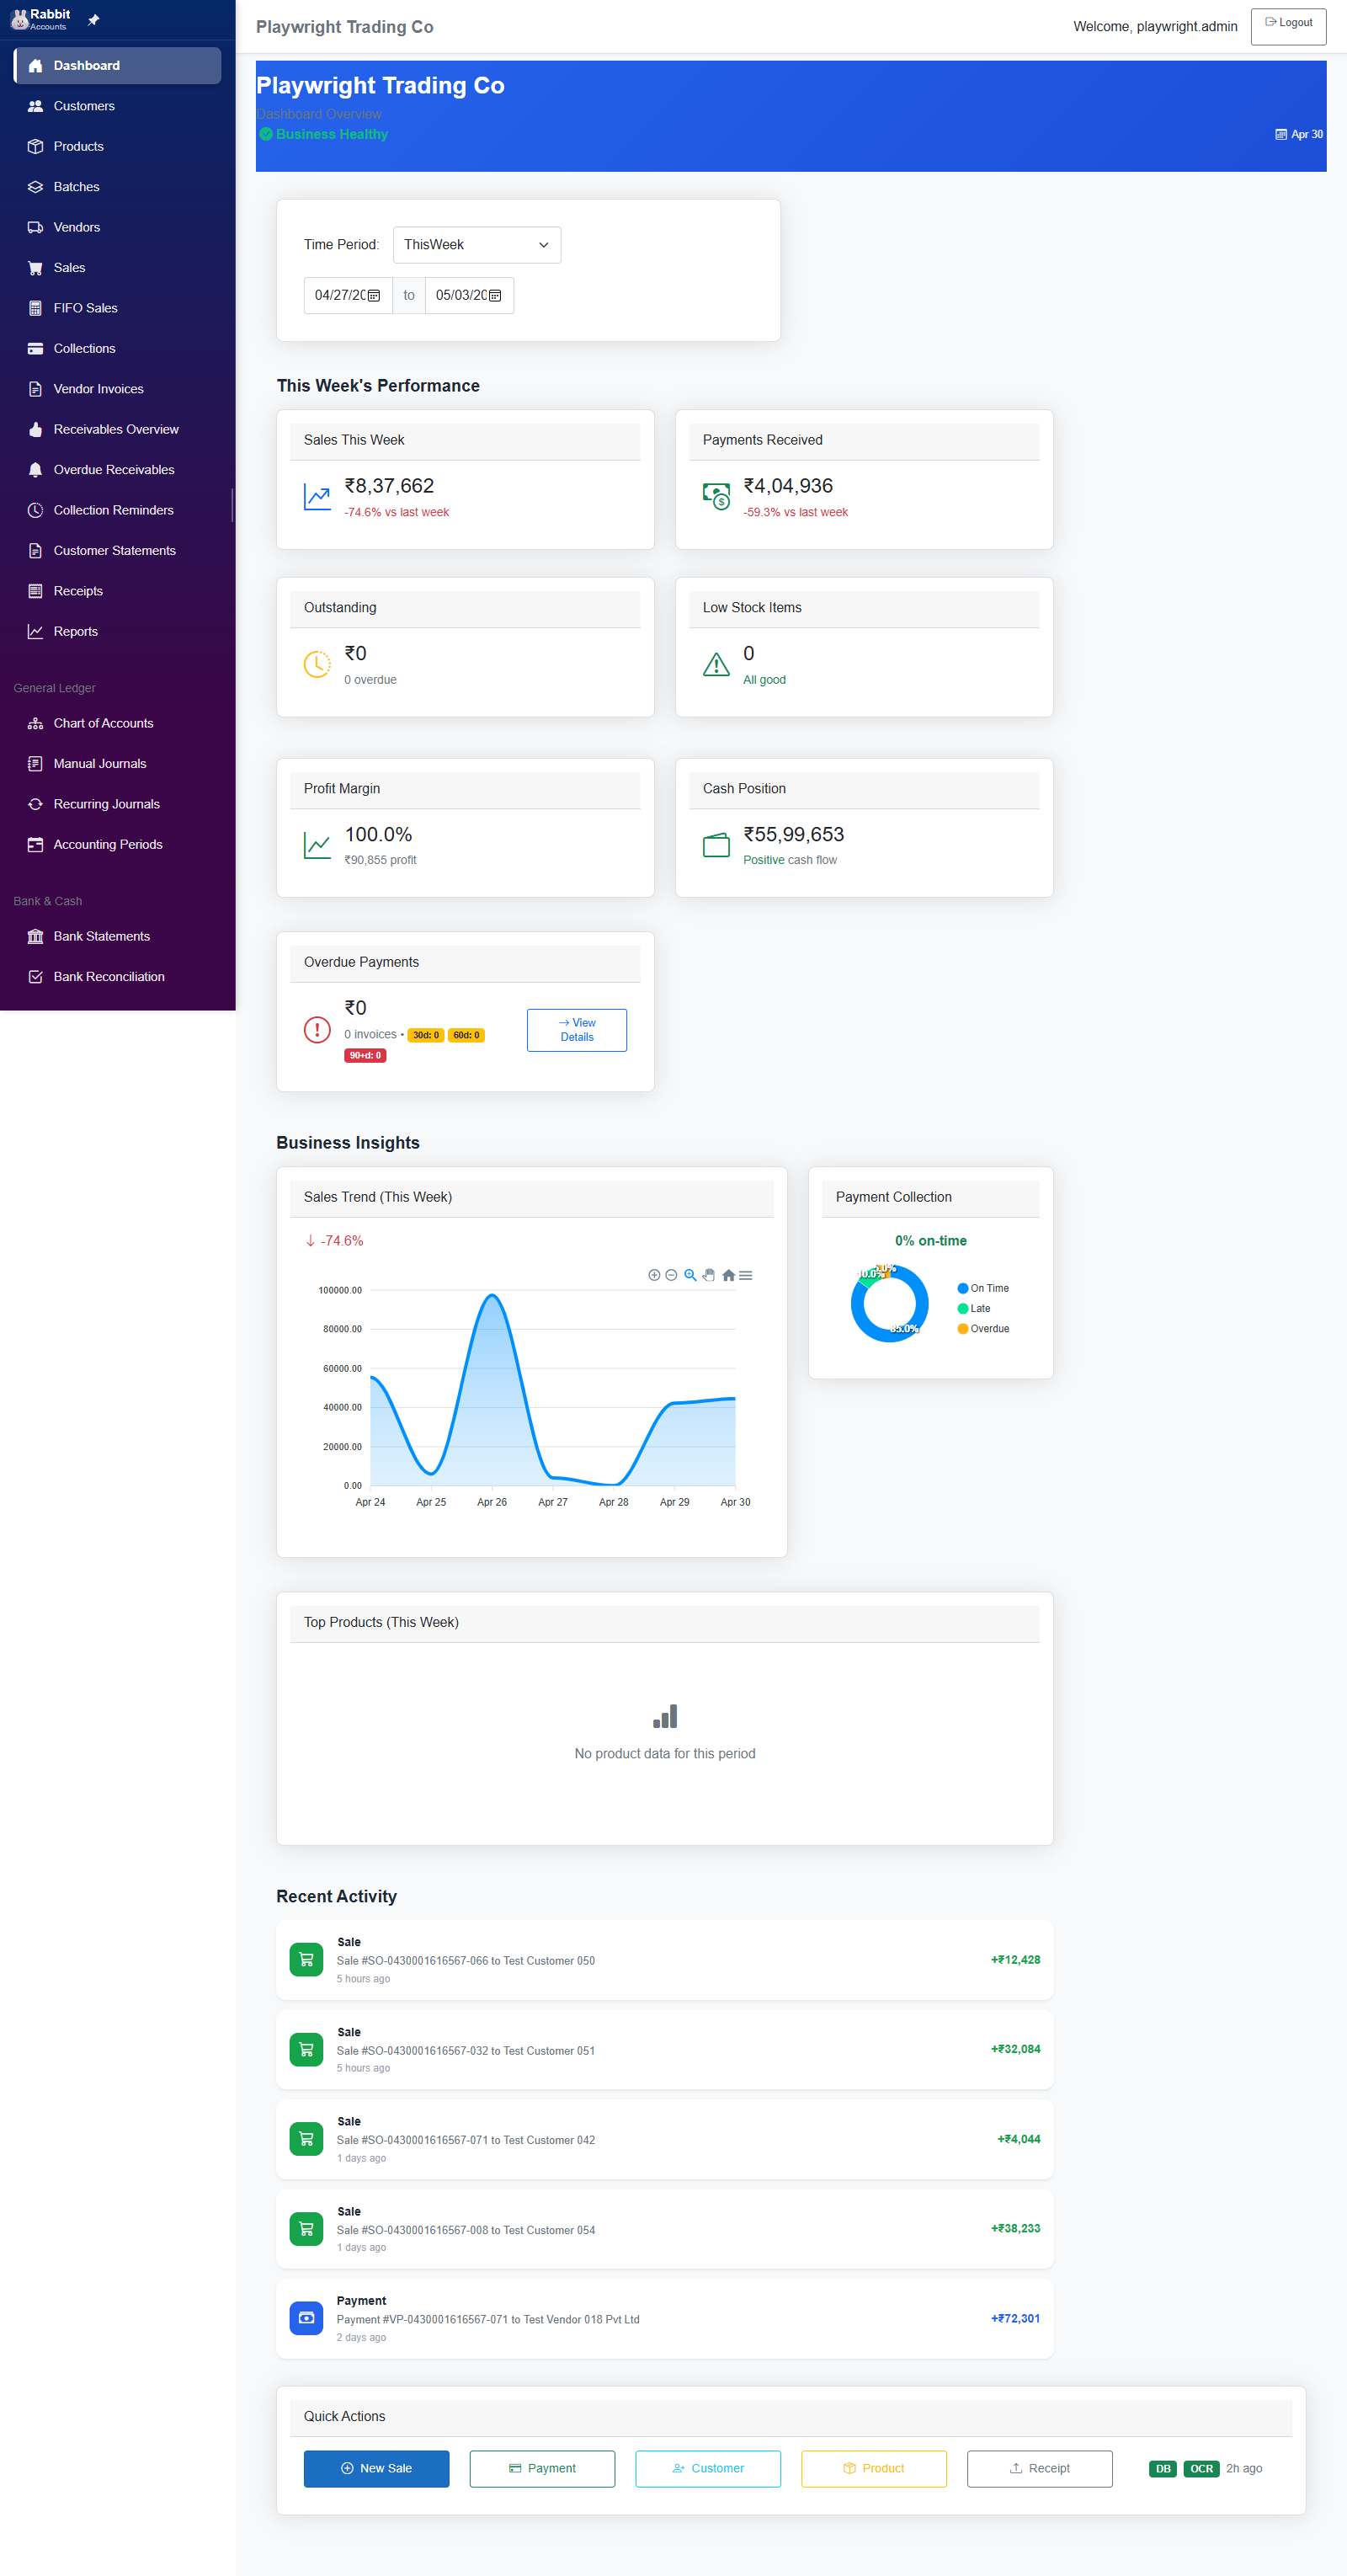
The Dashboard is the landing page after login, providing business health overview with KPIs, charts, and quick actions.
Functional
-
tests/catalog-route-coverage.spec.ts
Functional
covers /Account/Login shared entry surfacecovers /Account/AccessDenied recovery surfacecovers /Error fallback surfacecovers /admin system dashboardcovers /admin/businesses business management surfacecovers /admin/users user management surfacecovers /admin/settings configuration surfacecovers /admin/loginCredentials credential directorycovers /admin/login-credentials alias credential directorycovers /admin/test-data business-scoped data management surfacecovers / dashboard overview surfacecovers /admin/seed-batch-data batch seeding toolcovers /gl/chart-of-accounts account maintenance surfacecovers /settings business settings surfacecovers /recurring-journals recurring template surfacecovers /ar/collection-reminders collection rules surfacecovers /locations location management surfacecovers /stock-transfers transfer workflow surfacecovers /vendor-invoices payables invoice surfacecovers /ap/match-exceptions three-way match queuecovers /vendor-payment-allocation base allocation fallbackcovers /Account/Logout sign-out route
- tests/ui-improvements-validation.spec.ts Screen smoke
01-UC-Dashboard.md
UC-DASH: Dashboard Use Cases
Page: Home.razor
Route: /
Menu Position: 1 (Dashboard)
Overview
The Dashboard is the landing page after login, providing business health overview with KPIs, charts, and quick actions.
Section: Page Header & Business Context
| ID | Section | Action | Expected Outcome | Controls Affected |
|---|---|---|---|---|
| UC-DASH-001 | Header | Load Dashboard page | Business name displays, "Dashboard Overview" subtitle shows, current date displays | business-name, business-subtitle, date-info |
| UC-DASH-002 | Header | Business health indicator visible | Shows "Business Healthy" with green check icon | health-status |
Section: Time Period Filter
| ID | Section | Action | Expected Outcome | Controls Affected |
|---|---|---|---|---|
| UC-DASH-003 | Filter | Select "Today" from Time Period dropdown | Data refreshes for today only: (1) Sales amount updates, (2) Sales growth % recalculates vs yesterday, (3) Payments amount updates, (4) Payment growth % recalculates, (5) Section title changes to "Today's Performance", (6) Sales card header changes to "Sales Today", (7) Sales Trend chart title changes to "Sales Trend (Today)", (8) Sales Trend chart shows hourly data points (6 points: 00:00, 04:00, 08:00, 12:00, 16:00, 20:00), (9) Top Products chart title changes to "Top Products (Today)", (10) Top Products chart data updates, (11) Profit Margin recalculates for today, (12) From date input updates to today, (13) To date input updates to today | Time Period select=Today, section-title="Today's Performance", Sales card header="Sales Today", Sales h3 amount, Sales growth %, Payments h3 amount, Payment growth %, Profit Margin %, Gross Profit amount, Sales Trend chart title, Sales Trend chart canvas (hourly labels), Top Products chart title, Top Products chart canvas, From date input, To date input |
| UC-DASH-004 | Filter | Select "This Week" from Time Period dropdown | Data refreshes for Mon-Sun: (1) Sales amount = sum of week's sales, (2) Sales growth % = vs last week, (3) Payments amount = sum of week's payments, (4) Payment growth % = vs last week, (5) Section title = "This Week's Performance", (6) Sales card header = "Sales This Week", (7) Sales Trend chart title = "Sales Trend (This Week)", (8) Sales Trend chart shows 7 daily data points (Mon-Sun labels), (9) Top Products title = "Top Products (This Week)", (10) From date = Monday of current week, (11) To date = Sunday of current week | Time Period select=ThisWeek, section-title="This Week's Performance", Sales card header="Sales This Week", Sales h3 amount, Sales growth % (vs last week), Payments h3 amount, Payment growth %, Profit Margin %, Gross Profit amount, Sales Trend chart title, Sales Trend chart canvas (7 daily points), Top Products chart title, Top Products chart canvas, From date input, To date input |
| UC-DASH-005 | Filter | Select "This Month" from Time Period dropdown | Data refreshes for current month: (1) Sales amount = sum of month's sales, (2) Sales growth % = vs last month, (3) Section title = "This Month's Performance", (4) Sales card header = "Sales This Month", (5) Sales Trend chart shows daily points for each day of month, (6) From date = 1st of month, (7) To date = last day of month | Time Period select=ThisMonth, section-title="This Month's Performance", Sales card header="Sales This Month", Sales h3 amount, Sales growth %, Payments h3 amount, Payment growth %, Profit Margin %, Gross Profit amount, Sales Trend chart title="Sales Trend (This Month)", Sales Trend chart canvas (28-31 daily points), Top Products chart title="Top Products (This Month)", Top Products chart canvas, From date input, To date input |
| UC-DASH-006 | Filter | Select "Last 7 Days" from dropdown | Data refreshes for rolling 7 days: (1) Sales = sum of last 7 days, (2) Growth % = vs previous 7 days, (3) Section title = "Last 7 Days Performance", (4) Sales card header = "Sales Last 7 Days", (5) Chart shows 7 data points with date labels, (6) From date = today - 6 days, (7) To date = today | Time Period select=Last7Days, section-title="Last 7 Days Performance", Sales card header="Sales Last 7 Days", Sales h3 amount, Sales growth %, Payments h3 amount, Payment growth %, Profit Margin %, Gross Profit amount, Sales Trend chart title="Sales Trend (Last 7 Days)", Sales Trend chart canvas (7 points), Top Products chart title="Top Products (Last 7 Days)", Top Products chart canvas, From date input, To date input |
| UC-DASH-007 | Filter | Select "Last 30 Days" from dropdown | Data refreshes for rolling 30 days: (1) Sales = sum of last 30 days, (2) Growth % = vs previous 30 days, (3) Section title = "Last 30 Days Performance", (4) Sales card header = "Sales Last 30 Days", (5) Chart shows 30 data points, (6) From date = today - 29 days, (7) To date = today | Time Period select=Last30Days, section-title="Last 30 Days Performance", Sales card header="Sales Last 30 Days", Sales h3 amount, Sales growth %, Payments h3 amount, Payment growth %, Profit Margin %, Gross Profit amount, Sales Trend chart title="Sales Trend (Last 30 Days)", Sales Trend chart canvas (30 points), Top Products chart title="Top Products (Last 30 Days)", Top Products chart canvas, From date input, To date input |
| UC-DASH-008 | Filter | Select "This Year" from dropdown | Data refreshes for year-to-date: (1) Sales = sum of YTD sales, (2) Section title updates, (3) From date = Jan 1 of current year, (4) To date = Dec 31 of current year | Time Period select=ThisYear, section-title, Sales card header, Sales h3 amount, Sales growth %, Payments h3 amount, Payment growth %, Profit Margin %, Gross Profit amount, Sales Trend chart title, Sales Trend chart canvas, Top Products chart title, Top Products chart canvas, From date input=Jan 1, To date input=Dec 31 |
| UC-DASH-009 | Filter | Enter custom From date (e.g., Dec 1) | (1) Time Period dropdown changes to "Custom", (2) Data filters from Dec 1 to current To date, (3) Sales/Payments/Profit recalculate for custom range | Time Period select=Custom, From date input=user value, Sales h3 amount, Sales growth %, Payments h3 amount, Payment growth %, Profit Margin %, Gross Profit amount, Sales Trend chart canvas, Top Products chart canvas |
| UC-DASH-010 | Filter | Enter custom To date (e.g., Dec 15) | (1) Time Period dropdown changes to "Custom", (2) Data filters from current From date to Dec 15, (3) All metrics recalculate | Time Period select=Custom, To date input=user value, Sales h3 amount, Sales growth %, Payments h3 amount, Payment growth %, Profit Margin %, Gross Profit amount, Sales Trend chart canvas, Top Products chart canvas |
| UC-DASH-011 | Filter | Enter From=Dec 1, To=Dec 10 | (1) Preset = Custom, (2) Sales = sum for Dec 1-10, (3) Payments = sum for Dec 1-10, (4) Profit Margin = calculated for Dec 1-10, (5) Charts show 10 data points (Dec 1-10 labels) | Time Period select=Custom, From date input=Dec 1, To date input=Dec 10, Sales h3 amount, Sales growth %, Payments h3 amount, Payment growth %, Profit Margin %, Gross Profit amount, Sales Trend chart canvas (10 points), Top Products chart canvas |
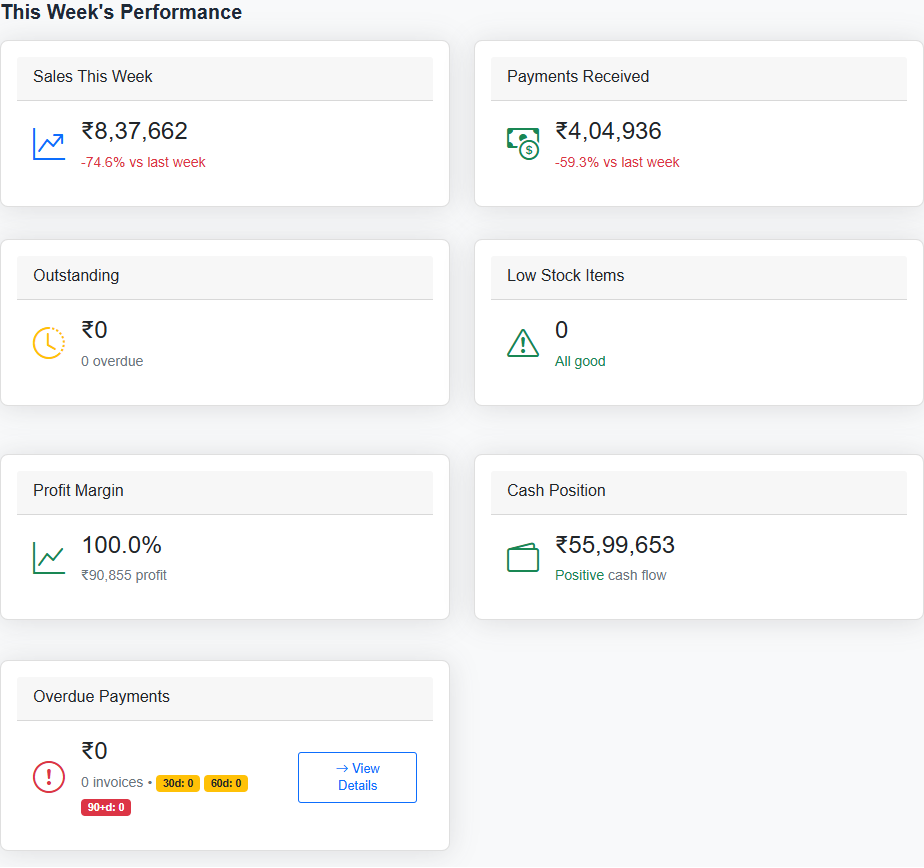
Section: Key Metrics Cards (Row 1)
| ID | Section | Action | Expected Outcome | Controls Affected |
|---|---|---|---|---|
| UC-DASH-012 | Sales Card | View Sales card | Shows sales amount in ₹ format (e.g., ₹1,23,456), growth % vs previous period | Sales card header, h3 amount, growth indicator |
| UC-DASH-013 | Sales Card | Sales growth positive | Green "+" percentage displayed, upward trend | growth indicator text-success class |
| UC-DASH-014 | Sales Card | Sales growth negative | Red "-" percentage displayed | growth indicator text-danger class |
| UC-DASH-015 | Payments Card | View Payments Received card | Shows payment amount in ₹ format, growth % displayed | Payments card |
| UC-DASH-016 | Outstanding Card | View Outstanding card | Shows total outstanding amount, overdue count (e.g., "5 overdue") | Outstanding card, overdue count badge |
| UC-DASH-017 | Low Stock Card | View Low Stock Items card | Shows count of low stock items | Low Stock card |
| UC-DASH-018 | Low Stock Card | Click on Low Stock card | Navigates to /inventory page | Navigation to Inventory |
| UC-DASH-019 | Low Stock Card | Low stock count > 0 | Warning icon (yellow), "Needs attention" text in red | icon, small text |
| UC-DASH-020 | Low Stock Card | Low stock count = 0 | Success icon (green), "All good" text | icon, small text |
Section: Business Intelligence Metrics (Row 2)
| ID | Section | Action | Expected Outcome | Controls Affected |
|---|---|---|---|---|
| UC-DASH-021 | Profit Margin | View Profit Margin card | Shows profit margin %, gross profit amount (₹) | Profit Margin card |
| UC-DASH-022 | Profit Margin | Margin > 30% | Green icon | profit margin icon |
| UC-DASH-023 | Profit Margin | Margin 15-30% | Yellow/warning icon | profit margin icon |
| UC-DASH-024 | Profit Margin | Margin < 15% | Red/danger icon | profit margin icon |
| UC-DASH-025 | Cash Position | View Cash Position card | Shows net cash position in ₹, "Positive/Negative cash flow" text | Cash Position card |
| UC-DASH-026 | Cash Position | Positive cash | Green icon, "Positive cash flow" | wallet icon, cash flow text |
| UC-DASH-027 | Cash Position | Negative cash | Red icon, "Negative cash flow" | wallet icon, cash flow text |
| UC-DASH-028 | Overdue | View Overdue Payments card | Shows overdue amount (₹), invoice count, breakdown badges (30d, 60d, 90+d) | Overdue card, badges |
| UC-DASH-029 | Overdue | Click "View Details" button | Navigates to /vendor-payments page | Navigation |
Section: Business Insights Charts
| ID | Section | Action | Expected Outcome | Controls Affected |
|---|---|---|---|---|
| UC-DASH-030 | Sales Trend | View Sales Trend chart | ACTUAL CHART displays (not placeholder), shows line/bar chart with sales data for selected period | Sales Trend chart canvas |
| UC-DASH-031 | Sales Trend | Change time period | Chart updates with new data points matching period | chart labels, chart data |
| UC-DASH-032 | Sales Trend | Hover on chart points | Tooltip shows date and sales amount | Chart tooltip |
| UC-DASH-033 | Payment Collection | View Payment Collection chart | ACTUAL CHART displays showing On Time/Late/Overdue percentages as pie/donut | Payment Collection chart |
| UC-DASH-034 | Top Products | View Top Products chart | ACTUAL CHART displays horizontal bar chart with top 5 products by revenue | Top Products chart |
| UC-DASH-035 | Top Products | Change time period | Chart updates with top products for selected period | Top Products chart data |
Section: Recent Activity Feed
| ID | Section | Action | Expected Outcome | Controls Affected |
|---|---|---|---|---|
| UC-DASH-036 | Activity | View Recent Activity | Shows up to 5 recent activities with icon, title, details, time ago | activity-feed list |
| UC-DASH-037 | Activity | Activity has amount | Shows "+₹X" or "-₹X" with appropriate color | activity-amount |
| UC-DASH-038 | Activity | No recent activities | Shows "No recent activity" message with icon | empty state message |
| UC-DASH-039 | Activity | Time display | Shows "Just now", "X minutes ago", "X hours ago", "X days ago", or date | activity-time |
Section: Quick Actions
| ID | Section | Action | Expected Outcome | Controls Affected |
|---|---|---|---|---|
| UC-DASH-040 | Quick Actions | Click "New Sale" button | Navigates to /sales page | Navigation |
| UC-DASH-041 | Quick Actions | Click "Payment" button | Navigates to /payments page | Navigation |
| UC-DASH-042 | Quick Actions | Click "Customer" button | Navigates to /customers page | Navigation |
| UC-DASH-043 | Quick Actions | Click "Product" button | Navigates to /products page | Navigation |
| UC-DASH-044 | Quick Actions | Click "Receipt" button | Navigates to /receipts page | Navigation |
Section: Data Validation Requirements
| ID | Validation | Requirement |
|---|---|---|
| UC-DASH-045 | Sales Amount | Must show non-zero value when sales exist for period |
| UC-DASH-046 | Payments Amount | Must show non-zero value when payments exist for period |
| UC-DASH-047 | Chart Data | Charts must render actual visualizations, NOT "Chart visualization" placeholder |
| UC-DASH-048 | Currency Format | All amounts must use Indian ₹ format with commas (₹1,23,456) |
| UC-DASH-049 | Growth Calculation | Growth % must be calculated vs previous equivalent period |
| UC-DASH-050 | Period Labels | Card headers and chart titles must reflect selected period |
Section: Unit Test Coverage
| Test Class | Test Count | Coverage Areas | Related Use Cases |
|---|---|---|---|
DashboardCalculationTests |
25 | Date calculations, growth %, profit margin thresholds, time formatting, period labels | UC-DASH-003 to UC-DASH-050 |
Unit Tests Summary
Location: Rabbit.Accounts.Tests/Dashboard/DashboardCalculationTests.cs
Test Categories:
- GetStartOfWeek Tests (7 tests) - Week boundary calculations for "This Week" period filter
- GetEndOfWeek Tests (3 tests) - Sunday calculation for week endings
- SetDatesFromPreset Tests (9 tests) - All date range presets (Today, ThisWeek, ThisMonth, Last7Days, Last30Days, ThisYear, Custom)
- GetTimeAgo Tests (6 tests) - Time ago formatting ("Just now", "X minutes ago", "X hours ago", "X days ago")
- GetProfitMarginColor Tests (10 tests) - Threshold-based color coding (success/warning/danger)
- ConvertPresetToLegacyPeriod Tests (7 tests) - Enum to string conversion
- Growth Calculation Tests (5 tests) - Positive/negative/zero growth percentages
- Net Cash Position Tests (3 tests) - Cash flow calculations
- Gross Profit Tests (4 tests) - Revenue minus COGS calculations
- Period Label Tests (12 tests) - Dynamic section titles and sales labels
Note: Dashboard is primarily a UI/display page. Service layer tests (DashboardService) would require database mocking. The pure calculation logic tested here covers all date filtering, growth calculations, and threshold-based display logic used by the dashboard.
Total Use Cases: 50
Screen snapshots
Open any image for a closer look. The manual keeps screenshots on screen pages so the index stays light.